RISK MANAGEMENT: THE 2026 SOVEREIGN SHIELD
Survival in the decentralized markets of 2026 requires more than a simple strategy. It requires a defensive architecture. This report unfolds the technical truth regarding capital preservation and the dark mechanics of the industry that thrive on your failure.
Report Briefing:
Institutional Intelligence Report #882
To reach consistent results, you must outsmart your own biology and the brokers using your head to generate their own liquidity.

THE B-BOOK REVENUE MODEL: STRUCTURAL CONFLICT OF INTEREST
To truly unfold the truth about modern derivative trading, we must dismantle the carefully constructed illusion of the “partner” broker. In the retail sector, the overwhelming majority of participants are unknowingly operating within a closed-loop B-Book ecosystem. In this structural arrangement, the broker does not act as an intermediary to the interbank market; instead, they function as the ultimate counterparty to every position you open.
Unlike traditional Stock Investing where capital is deployed into tangible equity, CFDs are purely synthetic contracts. This allows B-Book entities to utilize “Virtual Dealer” plugins—sophisticated software designed to delay execution or manipulate price spreads during periods of high-impact volatility. By creating artificial slippage, the house ensures that even a correct market thesis can result in a liquidated stop loss.
The profitability of the B-Book model is mathematically tethered to the net loss of the client base. This creates a toxic environment where the broker’s technical departments are incentivized to identify “profitable” traders and migrate them to different execution profiles or limit their leverage. You can read the full mechanical breakdown of how order flow is categorized in our report on A-Book vs B-Book Forex Truth.
Negative Slippage Bias
Algorithms programmed to fill orders at the worst possible price within a millisecond range, siphoning pips from every retail entry.
Liquidity Shadowing
Simulated depth of market (DOM) that vanishes as price approaches large retail stop clusters, forcing execution at extreme price points.
The Casino Logic
Reference ID: 2026-BB-PROTOCOL
Rigorous Risk Management is the only mathematical shield capable of breaking this cycle and forcing your orders into a transparent market.
THE ATR DEFENSE: ALGORITHM-PROOF STOPS
Most retail traders fail because they place their protective “stop loss” exactly where the market expects them to. You likely place yours at a round number, a recent low, or a support level. To a High-Frequency Trading (HFT) algorithm, these are not levels; they are “liquidity clusters.” The big players drive price into these zones just to trigger your stops, collect your capital, and then move the price back in the original direction.
To stop being “hunted,” you must use the Average True Range (ATR). Think of ATR as the “breath” of the market. If the market is breathing (moving) 50 pips an hour, and you set a 20-pip stop, you are guaranteed to get stopped out even if you are right about the trend. A professional uses a multiplier (usually 2x or 3x the ATR) to ensure their stop is outside the “noise” of the market.
Volatility is dynamic. If a pair usually moves 80 pips a day but suddenly spikes to 200 pips due to a news event, you must adjust. Keeping the same lot size during high volatility is the fastest way to blow an account. This lack of mathematical adjustment is among the most Common Trading Mistakes that B-Book brokers rely on for their revenue.
By calculating your risk based on technical volatility rather than hope, you become invisible to the hunters. You only exit when the market structure has truly shifted, not when an algorithm decides to “sweep” the retail orders.
The Survival Difference
Sets a stop at 20 pips because “it feels safe.” The algorithm sweeps this level easily, and the trader is liquidated before the real move happens.
Checks ATR (e.g., 40 pips). Sets stop at 2.5x ATR (100 pips). Reduces position size to keep dollar risk identical. Stays in the trade while others are liquidated.
“Adapt your risk to the market, don’t ask the market to adapt to your risk.”
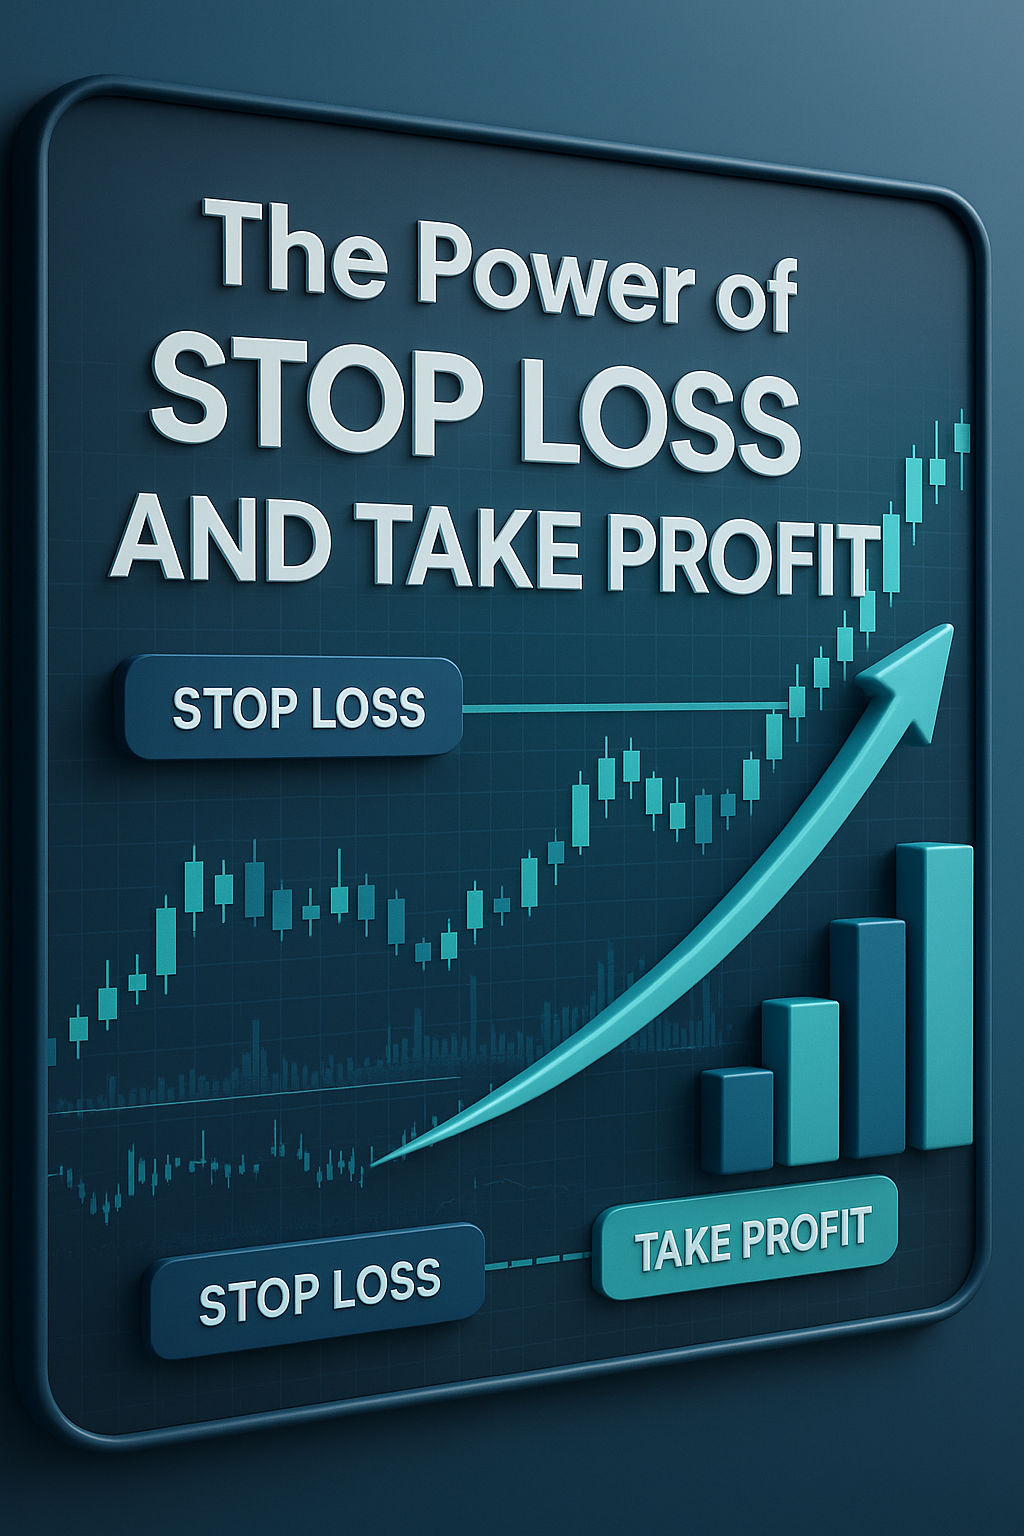
THE EXECUTION TRINITY: SL, TP, AND THE LEVERAGE TRAP
Setting a Stop Loss (SL) and Take Profit (TP) is not a clerical task; it is the fundamental architecture of your trade. Most beginners make the mistake of choosing their “Position Size” based on how much money they want to make. An institutional trader does the opposite. They find the correct technical exit first, then calculate the size.
To master this, you must understand that your Stop Loss defines your risk, and your Position Sizing defines your survival. If you are placing arbitrary 10-pip stops just so you can trade a larger lot size, you are playing into the hands of the B-Book dealer. For a deep dive into the technicalities of this process, see our master guide on Advanced Risk Management.
Then there is the “Silent Killer”: Leverage. Retail brokers offer 1:500 or 1:1000 leverage to give you the illusion of power. In reality, leverage is a double-edged sword that increases the “friction” of your account. The higher the leverage, the smaller the market “hiccup” required to trigger a margin call.
You should never use leverage to trade more than your account can handle; you should use it only to facilitate the correct position size dictated by your ATR-based Stop Loss. We unfold the dangerous truth about how brokers weaponize this tool in our investigative report on Leverage in Trading.
The 3-Step Protocol
STATUS: Institutional Compliance
Academic Authority: Kelly & Expected Value
Trading is a game of Expected Value (EV). The formula is: (Probability of Win * Win Amount) – (Probability of Loss * Loss Amount). Professionals use the Kelly Criterion to determine the optimal size for a trade. It dictates that your stake should be proportional to your edge. If you have no edge, your stake should be zero.
Retail traders often increase their stakes when they are losing to catch up. This violates every law of probability. By never risking more than 1 percent of your equity, you allow for a losing streak of 30 trades without destroying your base.
Applying institutional formulas transforms you from a speculator into a capital manager. This shift is required to survive the dark side and build long term wealth in the CFD markets. Explore our guide on Trading Psychology for more.
THE 2015 SNB SHOCK: LEVERAGE AS A WEAPON
The Black Swan
In January 2015, the Swiss National Bank removed the floor on the EUR/CHF exchange rate without warning. In seconds, the pair dropped thousands of pips. Liquidity evaporated, and price discovery ceased to exist. This remains the definitive proof that markets are not linear.
Institutional Ruin
When price gaps past your stop loss, your plan is tested. Traders using 500x leverage did not just lose their equity; they ended up with negative balances, owing brokers millions. This event bankrupted major retail firms and wiped out thousands of retail “donors” in minutes.
The 1% Buffer
Historical analysis shows that those who survived the 2015 shock or the 2020 COVID crash were the ones risking 1 percent or less per trade. They had the capital buffer to absorb massive slippage. If you ignore history, you are destined to be a casualty of the next major re-pricing.
“A stop loss is a request; low leverage is a guarantee.”
INSTITUTIONAL TOOLSET: TACTICAL EXECUTION
A strategy is only as strong as the tools used to implement it. To bypass the B-Book trap, you must move beyond the basic indicators provided by retail platforms and adopt a professional defensive stack.
Volatility Filter
This technical overlay identifies when the market is moving into a fat-tail event where normal stop losses will fail. It standardizes your risk by measuring the standard deviation of price movement, ensuring you never enter a high-volatility environment with low-volatility risk parameters.
Equity Curve Protocol
Treat your performance like a stock. By tracking your P&L against a 20 day moving average, you create an objective exit for your strategy. When your curve drops below the average, you must reduce your position sizes by 50 percent until the edge returns.
By combining these technical expansions with the truth regarding broker mechanics, you create an environment where success is a matter of statistical probability rather than luck. You can find more details in our Common Trading Mistakes library.
Correlation Matrices: Managing Hidden Leverage
Failure to identify correlated exposure is lethal. If you are long on EURUSD, GBPUSD, and AUDUSD, you are 3x leveraged on USD weakness. A Correlation Matrix calculates the coefficient between different pairs. When two pairs have a correlation above +0.80, they move in lockstep.
Institutional managers use this tool to offset risk. B-Book brokers want you to have maximum exposure because when the USD spikes, all your positions will hit margin calls simultaneously. This cluster liquidation is a primary revenue source for the house.
By utilizing a Correlation Matrix, you ensure that your Total Account Risk never exceeds your thresholds. This is the difference between a gambler and a capital manager. Review our A-Book vs B-Book guide for more.

EQUITY CURVE TRADING: MANAGING THE BUSINESS
Professionals do not just manage their trades; they manage their performance as a living entity. Equity Curve Trading is the advanced practice of applying technical indicators to your own profit and loss graph. If your daily equity falls below its 20 day moving average, you have objectively lost your edge.
In this scenario, the protocol dictates an immediate de-risk by cutting position sizes by 50 percent. This prevents the Death Spiral where a trader attempts to trade their way out of a loss, which only leads to a deeper psychological and financial hole.
Mastering this level of discipline is the only way to adhere to the numbers when the pressure is high. To dive deeper into the mindset required for this, review our Psychology Guide for institutional execution.
The B-Book Conflict
The Trap: Brokers profit when you keep trading at full size during a drawdown. They want you to stay aggressive when you are most vulnerable.
The Solution: Using an Equity Curve tool makes it mathematically impossible to blow an account in a single month. It forces you to “fire” your strategy when it stops working.
Capital Security Level: Priority
The Risk of Ruin: Predicting the End
Risk of Ruin (RoR) calculates the probability of your account reaching zero. If you have a win rate of 35 percent and a reward to risk of 1:1, your risk of ruin is 100 percent. The math will eventually catch up to you. B-Book brokers offer bonuses to encourage high volume because they are waiting for the RoR table to do its job.
Even a small increase in risk per trade from 1 percent to 3 percent can skyrocket your probability of a total account wipeout. Professional desks never deviate from sizing protocols.
You are fighting the laws of probability. To stay on the right side of the math, always cross-reference your performance with the insights in our A-Book vs B-Book Forex Truth.