How to Read a Trading Chart
A trading chart is a forensic record of human greed and institutional manipulation. While the average retail trader sees “squiggly lines” or random movements, a professional technician sees a clear map of supply, demand, and trapped liquidity. If you cannot decode this data, you aren’t trading the market; you are the liquidity being harvested by it.
Stop chasing retail “patterns” and start looking for the truth behind price action. This guide strips away the broker marketing fluff to show you the market through the cold, calculated eyes of a forensic technician.

The Anatomy of Price Action
Brokers want you distracted by flashy indicators because it masks the simple truth: a chart is a forensic record of where money is actually moving. It tracks the exact moment where supply meets demand. If you do not understand the coordinates of this map, you aren’t trading the market; you are being harvested by it.
The X and Y Reality
The X-Axis (Timeframe Management): Time is the most underestimated variable. A 1 minute chart shows the noise of high frequency algorithms, while a Weekly chart reveals the long term institutional narrative. Professionals use the X-axis to filter out the retail traps that appear in lower timeframes.
The Y-Axis (Price Discovery): This is the vertical reality of value. It marks the precise levels where big banks are willing to commit capital or liquidate positions. Every tick on the Y-axis represents a shift in the market’s collective psychology.
Mastering these basics is the first step in unfolding the truth of market manipulation. When you see a “spike” on the chart, you aren’t just seeing a line move; you are witnessing a cluster of retail stop losses being triggered to fuel an institutional entry.
The OHLC Forensic Audit
- OPEN: The initial balance of power as the session starts.
- HIGH: The ceiling of greed where buyers ran out of fuel.
- LOW: The floor of panic where sellers were absorbed.
- CLOSE: The final verdict used by institutional algorithms.
Forensic Tip: Watch the gap between the Low and the Close. A large gap indicates a “V-shape” recovery where smart money absorbed the panic.
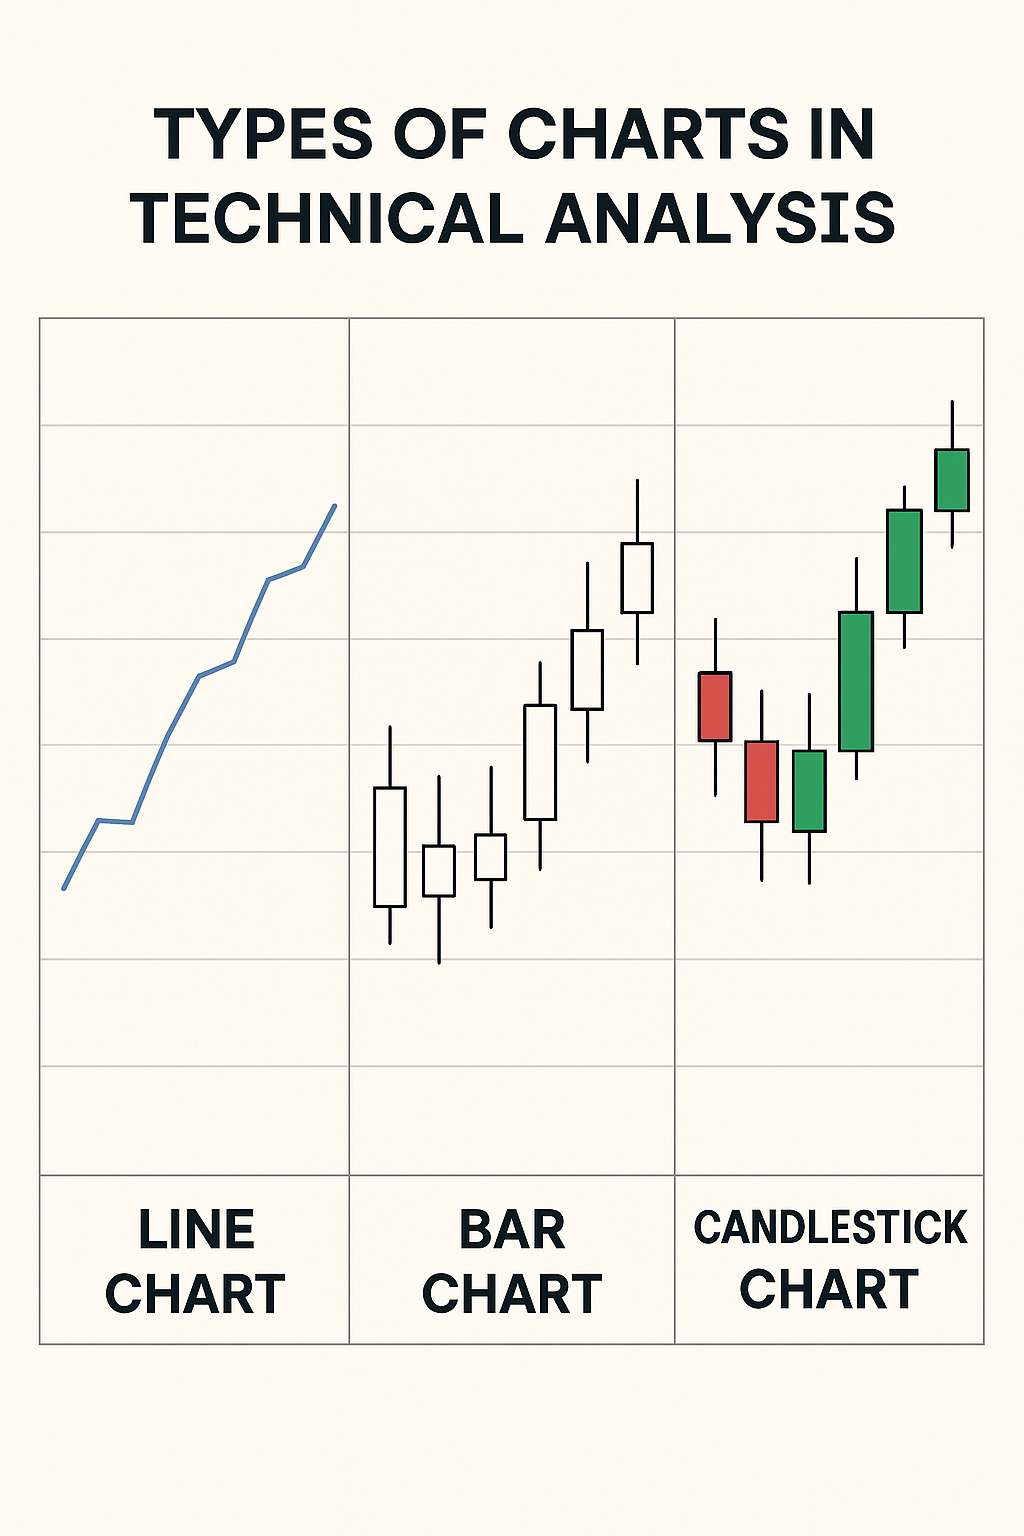
Line Charts: The Structural Reality
Retail traders often drown in the noise of candlesticks and volatile wicks. The line chart is your primary forensic tool for stripping away that clutter. By plotting only the closing prices, you are seeing the final consensus of value. This is the skeletal structure of the market, revealing where the price actually settled after the intra session chaos.
Forensic Execution Benefits
The Close Is King: Algorithms and institutional books focus on the close because it represents the price participants were willing to hold overnight. Line charts reveal these “real” support and resistance levels without the fakeouts caused by hunting stop losses in the wicks.
Trend Clarity: Identifying a true shift in market structure—such as a Break of Structure (BOS)—is significantly cleaner on a line chart. It prevents you from getting tricked by a “liquidity grab” that looks like a breakout on a candlestick chart.
- ✔ Absolute Noise Reduction: No distractions from high frequency algorithm spikes.
- ✔ Macro Confirmation: Perfect for identifying Higher Highs on daily or weekly timeframes.
- ✔ Psychological Shield: Reduces the emotional stress of watching every single price tick.

The line chart reveals the institutional skeletal trend.
Bar Charts: Range & Intensity
While line charts show the consensus, Bar Charts (OHLC) reveal the struggle. Each vertical bar is a forensic footprint of a session’s total range. The left tick is the entry of the battle, and the right tick is the exit. This view allows you to see the true intensity of market participation without the emotional distraction of colored candle bodies.
The Volatility Audit
Range Expansion: A long vertical bar indicates a high conviction move where one side completely overwhelmed the other. This is where institutional money is usually at work, clearing out orders and pushing the price toward a specific target.
Rejection Signals: If you see a bar with a long vertical “tail” and a close near the open, you are looking at a failed auction. The market attempted to find value at those levels but was aggressively rejected by a surge in opposing orders.
Professional technicians often prefer bar charts because they offer a “cleaner” look for complex technical analysis. By removing the thick candle bodies, you can focus purely on the price levels and the relationship between the range and the close.
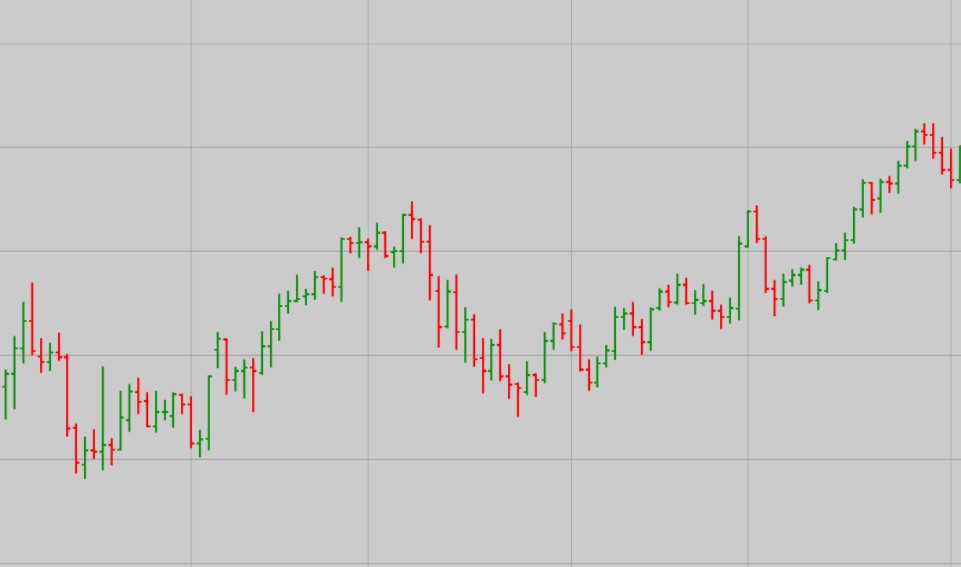
Bar charts reveal the battlefield range without the visual bias of color.
Candlesticks: Decoding the Crowd
Candlestick charts are the industry standard for one reason: they make market psychology visible at a glance. While bar charts show you the data, candlesticks show you the intensity of the emotion. The “real body” of the candle represents the actual territory won or lost by the bulls or bears, providing a forensic look at who is currently in control of the market narrative.
The Forensic Body & Wick Audit
Conviction vs. Hesitation: A long, full candle body suggests high conviction. This is where institutional algorithms are pushing price aggressively toward a target. Conversely, a small body with long wicks (Doji) suggests a total standoff where the market is searching for a new direction.
The Rejection Wick: Wicks (or shadows) are the forensic record of a failed attempt. A long upper wick proves that buyers pushed for higher prices but were met with a massive wall of supply, forcing price back down before the close.
- ✔ Visual Logic: Instantly identify bullish (green/white) or bearish (red/black) dominance.
- ✔ Pattern Detection: Identify high probability reversals like Hammers, Shooting Stars, and Engulfing patterns.
- ✔ Volume Context: Combine candle size with volume to distinguish between a real breakout and a retail trap.
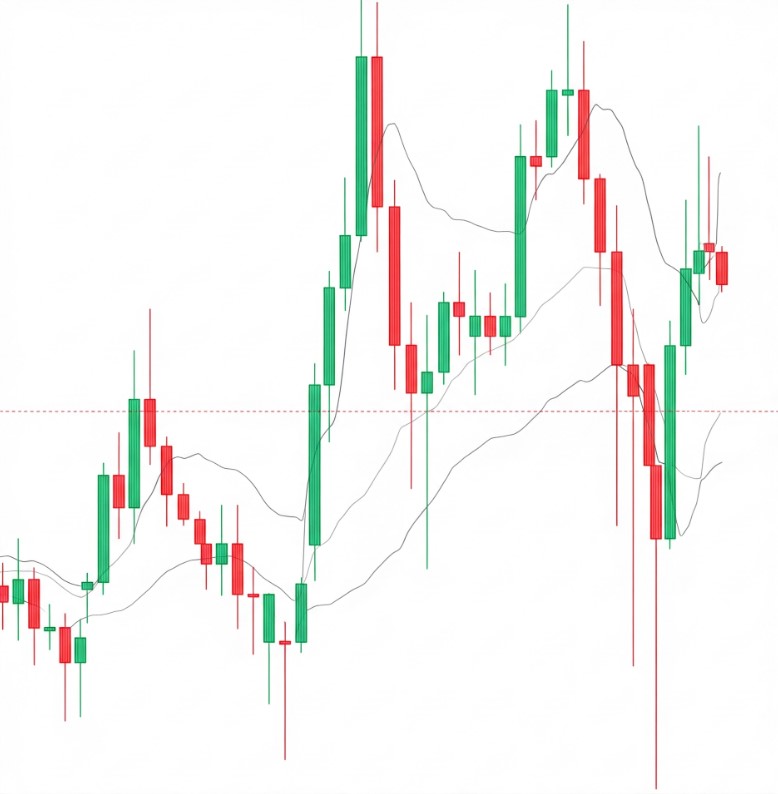
Candlesticks translate raw price action into psychological data points.
The Overanalysis Trap 🧠
Feeling lost in the squiggly lines? Every professional technician started exactly where you are right now. The difference between a pro and a gambler is that the pro eventually stops looking for “magic” and starts looking for logic.
“The chart is not a crystal ball. It is a record of where people were willing to put their money on the line. Stop trying to predict the future and start reacting to the present.”
Strategic Execution: Choosing Your Lens
Selecting a chart type is not a matter of preference; it is a tactical decision based on your objective. A professional technician does not stay married to one view. Instead, they rotate through different lenses to confirm a trade thesis or identify an institutional trap. Use the following forensic protocol to decide which view suits your current phase of analysis.
Use this during your macro analysis. It identifies major support and resistance levels while ignoring the intra session “liquidity hunts” that clutter your screen. If the line doesn’t break, the trend hasn’t changed.
Switch to this for your final execution. This is where you audit market sentiment. You are looking for rejection wicks, momentum shifts, and closing price conviction before putting capital at risk.
The dark side of trading involves brokers and market makers using “noise” to trigger your emotions. By alternating between a line chart for structural truth and a candlestick chart for execution timing, you create a psychological shield against these manipulations.
A multi-lens approach ensures you never trade a retail trap.
Volume: The Truth Serum
Price action tells you what happened, but Volume tells you why it happened. In the dark world of Forex and CFD trading, price can be easily manipulated by brokers to trigger your stop loss. However, true market volume is much harder to fake. It represents the actual “fuel” in the market’s tank. If price is moving but volume is dead, you are likely witnessing a retail trap.
The Forensic Volume Audit
Institutional Sponsorship: When you see a large candlestick accompanied by a massive spike in volume, it means the big players (banks and hedge funds) are active. This is “sponsored” movement. You want to trade in the same direction as this smart money conviction.
Divergence Warning: If price is making new highs but volume is steadily decreasing, the trend is exhausted. This is a forensic signal that the buyers are running out of breath and a massive reversal or “liquidity grab” is likely just around the corner.
Never trade price in a vacuum. A breakout on low volume is nothing more than an invitation for retail traders to buy the top so the institutions can sell into them. Always wait for volume to confirm that the move is real before you commit your capital.
The Technician’s Rule:
Volume precedes price. If you see volume surging while price is still sideways, get ready. The explosion is coming.
Fractal Logic: Zooming Into the Truth
Markets are fractal, which means the same patterns repeat across different scales of time. A massive bullish breakout on a 5 minute chart is often just a tiny, insignificant “blip” within a dominant bearish trend on the Daily chart. Retail traders get liquidated because they zoom in too far and mistake noise for a new trend. Professionals always start from the outside in to avoid being trapped in the wrong direction.
The Top-Down Protocol
1. The Daily (The Narrative): This is where you find the institutional footprints. It tells you the major bias of the market. If the Daily chart is bearish, you should be extremely cautious about taking “buy” setups on lower timeframes.
2. The 4-Hour (The Structure): This is your battleground. It identifies the key zones where price is likely to react. It bridges the gap between the big picture and your specific entry.
3. The 15-Minute (The Execution): This is your sniper scope. Once the higher timeframes align, you use the 15 minute chart to time your entry with precision, minimizing your risk and maximizing your potential reward.
The dark side of price action is that brokers encourage fast, low timeframe trading because it leads to more emotional mistakes and more commissions. By mastering fractal logic, you stop being a gambler and start being a technician who only trades when the macro and micro trends are in perfect alignment.
Always align your entry with the institutional narrative.
Decoding is Only the Beginning
You now speak the visual language of the markets. However, knowing how to read a chart is like knowing how to read a map while sitting in a parked car. To actually move, you must understand the dark side of execution, the psychology of the players, and the brutal reality of risk. Most traders fail not because they can’t see the trend, but because they can’t manage themselves once the trade is live.
Unfold the truth about the markets before the markets unfold your capital. Every tick on that screen tells a story of liquidation or accumulation. Make sure you aren’t the protagonist of a retail tragedy.
